
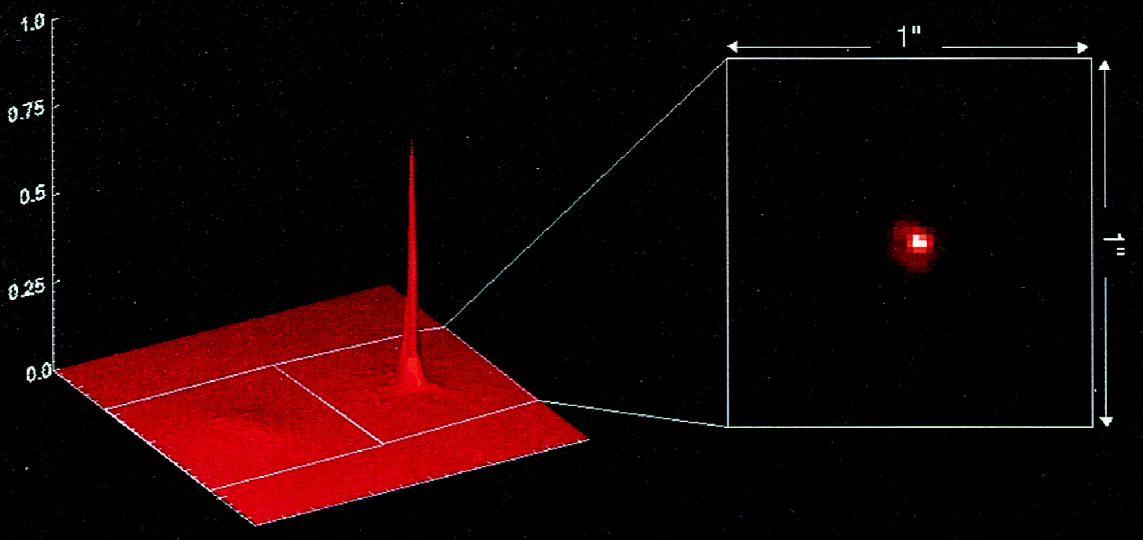
FIG. 1 Intensity vs. image plane position plots, at left, of an uncorrected (small bump) and AO-corrected (high peak) stellar image of a 9th magnitude star taken in H band on 1999 February 6. The FWHM decreased from 340 mas to 40 mas while the peak intensity, or Strehl ratio, increased from 0.6% to 30%. A 1" × 1" display of the corrected, 16 s integration, image is shown on the right.